Implementing Smart Texting Reduces ER Visits and Hospital Admissions
In 2020, the United States spent an estimated $208.9 billion on cancer care.1 Approximately 1.96 million new cancer cases were diagnosed in the US in 2023, and the national 5-year survival rate increased to 68% from 49% in 1970.2 Although improvements in survivorship are primarily linked to new treatments, the cancer journey has also changed over the past 10 to 15 years with the adoption of innovative technologies that have improved the patient experience during and after treatment. At scale, these technologies have helped providers manage treatment adverse effects and toxicities and improve patient quality of life (QOL) and the ability to work during treatment. Despite these efforts, 57.2% of patients with cancer will have an inpatient (IP) admission,3 and 83% of patients with cancer will have an emergency department (ED) visit at some point in their care.4 The oncology journey is further complicated by the number of providers involved in care; patients often have at least 2 and frequently more than 4 specialists (eg, in medical oncology, radiation oncology, surgery, primary care, cardiology) engaged in their care. Anxiety around the financial toxicity associated with cancer treatment is a common concern as patients become aware of the increasing costs of drugs and the associated care and are fearful of the financial strain on their families. Today, oncology teams must treat the disease while simultaneously working to mitigate treatment-related stress and improve overall QOL.
To develop its own process to measure IP admissions and ED visits within 30 days of chemotherapy, Mercy used its electronic health record to create a corresponding dashboard.
Medicare Outpatient Quality Measures
When the Centers for Medicare & Medicaid (CMS) reviewed the 2007 commercial claims of 14 million patients with cancer, the agency found that patients averaged 1 admission and 2 ED visits per year; 40% of the IP admissions and 50% of the ED visits were directly related to their chemotherapy treatment.5 The review identified gaps in care that, if addressed, could reduce these IP admissions and ED visits and improve patients’ QOL.6 Accordingly, as part of its Hospital Outpatient Quality Reporting Program, CMS developed and published its 35th outpatient metric (commonly referred to as OP35) to help quantify IP admissions and ED visits that occur within 30 days of hospital-based outpatient chemotherapy treatments for non-leukemia patients 18 years and older.7 This metric went into effect on January 1, 2020.
Although OP35 measures 2 outcomes, an IP admission and an ED visit, a patient can only be assigned a single outcome. Thus, patients presenting for an ED visit who are subsequently admitted will be counted only as a single IP admission. To have a consistent methodology for these metrics, CMS provided a list that defined chemotherapy and a list of associated oncology-related clinical diag- noses to be used as the numerator to calculate the rates: anemia, nausea, dehydration, neutropenia, diarrhea, pain, emesis, pneumonia, fever, or sepsis. The denominator was Medicare fee-for-service patients 18 years and older with a cancer diagnosis (excluding leukemia) who have received at least 1 outpatient chemotherapy treatment during the 30-day performance period. The 10 diagnoses associated with an IP admission or ED visit are common adverse effects of most chemotherapy agents; most patients with cancer experience them at some point in their journey.
The initial 2020 CMS claims-based benchmark rates were 12.9% for IP admissions and 6.1% for ED visits. Recognizing the significance of these metrics for cost and quality of care, CMS lowered these benchmark rates in 2024 to 10.6% and 5.5%, respectively.
CMS has since initiated the Enhanced Oncology Model (EOM), which offers both upside and downside risks in a value-based model that incorporates the OP35 quality metric, as well as other quality measures such as electronic patient-reported outcomes (ePROs) to digitally measure symptoms and toxicities such as pain assessment and management. Thus, the measurement of IP admissions and ED visits continues to be a significant metric and will be for the near future.
How Mercy Addressed OP35
The OP35 measure is a claims-based metric that is not published for a health system until many months after the IP admission or ED visit. To develop its own process to measure IP admissions and ED visits within 30 days of chemotherapy, Mercy used its electronic health record (EHR) to create a corresponding dashboard. In 2019, Mercy performed a review of approximately 100000 chemotherapy encounters under an institutional review board protocol. The goal: to establish Mercy’s rate of IP admissions and ED visits using the same OP35 criteria CMS would use in its claims-based analysis. The review was performed to identify the risk factors associated with IP admissions and ED visits and then design a machine learning predictive model to identify patient cohorts that could be targeted for additional clinical support to reduce these admissions and visits. The review identified IP admission and ED visit rates of 16.8% and 11.8%, respectively. Both metrics exceeded the initial published CMS benchmark rates. Mercy recognized that many of the targeted diagnoses in the OP35 metric (eg, anemia, nausea, dehydration) could be managed in the outpatient setting. But how?
Refining the Chen Model
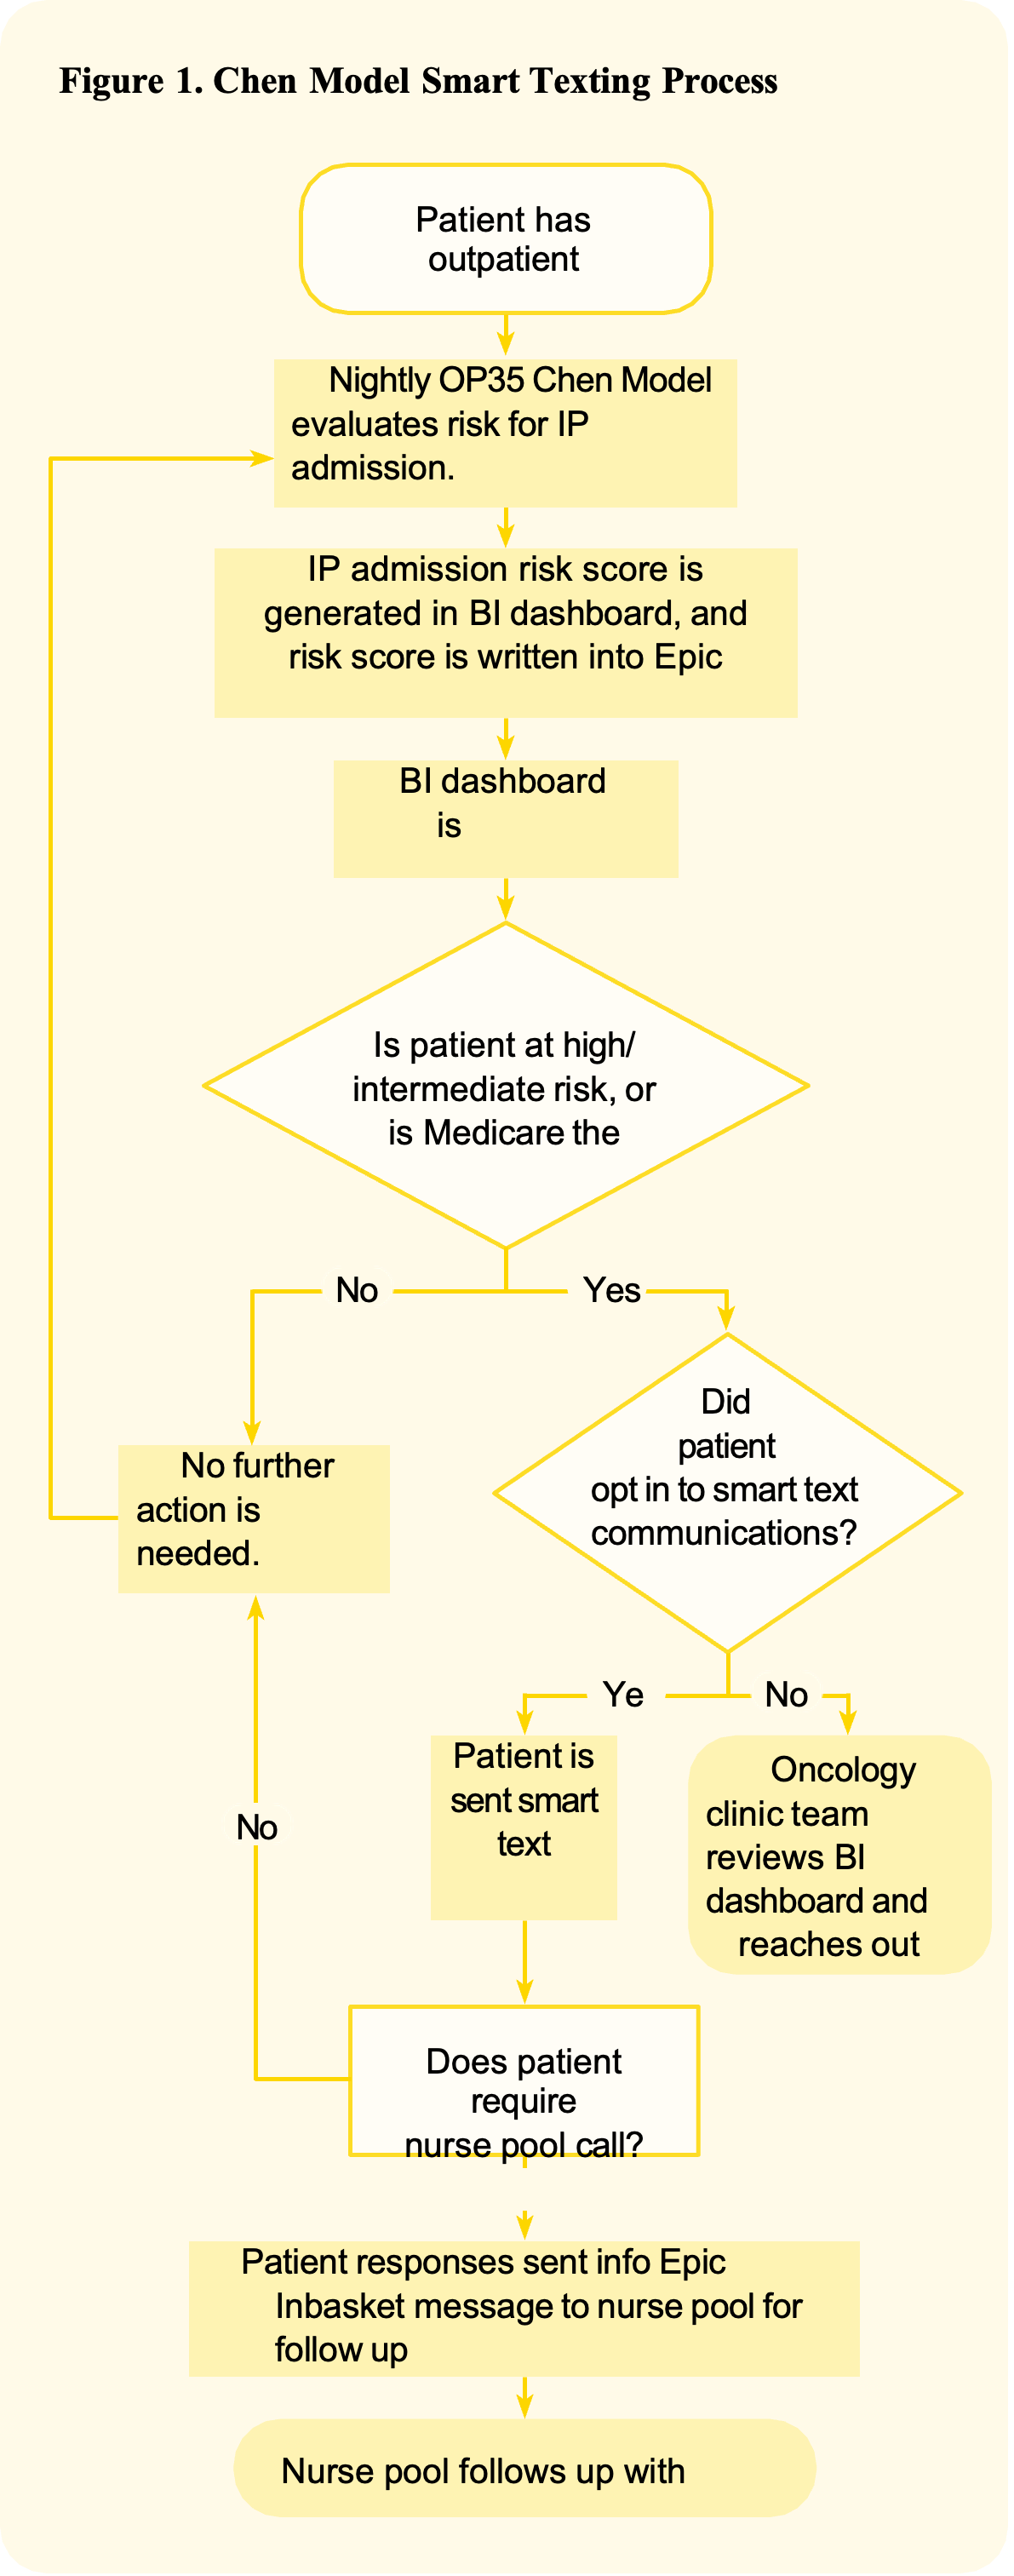
Mercy named its predictive Chen Model, which targets risks associated with the OP35 metrics, after the lead data scientist Jiajing Chen who developed it and then lost her own battle with cancer in January 2023. This model divided patients into high, intermediate, and low risk for an IP admission or ED visit. The Chen Model was programmed to run every night, evaluate the most recent EHR data, and assign a risk score that was then shared with the clinical team the next morn- ing. Specifically, the results were posted to a Microsoft Power BI (business intelligence) dashboard that was available to oncology providers and operational leaders. With this dashboard, data could be sorted by region, facility, clinic, provider, cancer type and stage, chemotherapy agent, day of the week, time of day, and the associated OP35 diagnosis for any IP admission or ED visit. The most common diagnoses for IP admissions were sepsis, anemia, and pneumonia, and the most common diagnoses for ED visits were pain, dehydration, and nausea. Although this dashboard had valuable information, it required providers and operational leaders to go into a tool that resided outside the EHR to identify the high-risk patients. To increase the efficiency of obtaining the risk score, the Chen score is now populated on the EHR’s storyboard and made available to the entire clinical team.
Implementing Smart Texting
EOM participation meant that Mercy would be required to develop ePROs by year 3 of the EOM contract. This requirement drove early adoption of Mercy’s ePRO initiative to proactively engage with patients via a smart texting system, specifically focusing on OP35 diagnoses and particularly those that could be managed in the out- patient setting. To do so, Mercy configured the Chen Model to then send an automated text to patients whom the model had identified as high risk. The day after chemotherapy, these patients receive a smart text daily for 7 days, excluding holidays and weekends; patients can opt out anytime. To be eligible to receive a text, the following text logic had to be met:
• Patient is alive
• Patient is not currently admitted to the hospital
• Patient has received chemotherapy in the past 7 days
• Patient had an office visit in the prior 120 days of chemotherapy in a medical oncology or gynecologic oncology office
• Patient has a cell phone number on file or a caregiver to whom the text could be delegated.
Automated texts were sent to only the 20% of patients identified as being at highest risk by the Chen Model. Today, education on the smart texting program is part of the standard chemotherapy education provided to patients before starting their treatment. Figure 1 shows Mercy’s smart texting process, and Figure 2 is an example of the smart texts sent to the top 20% of patients at high risk.


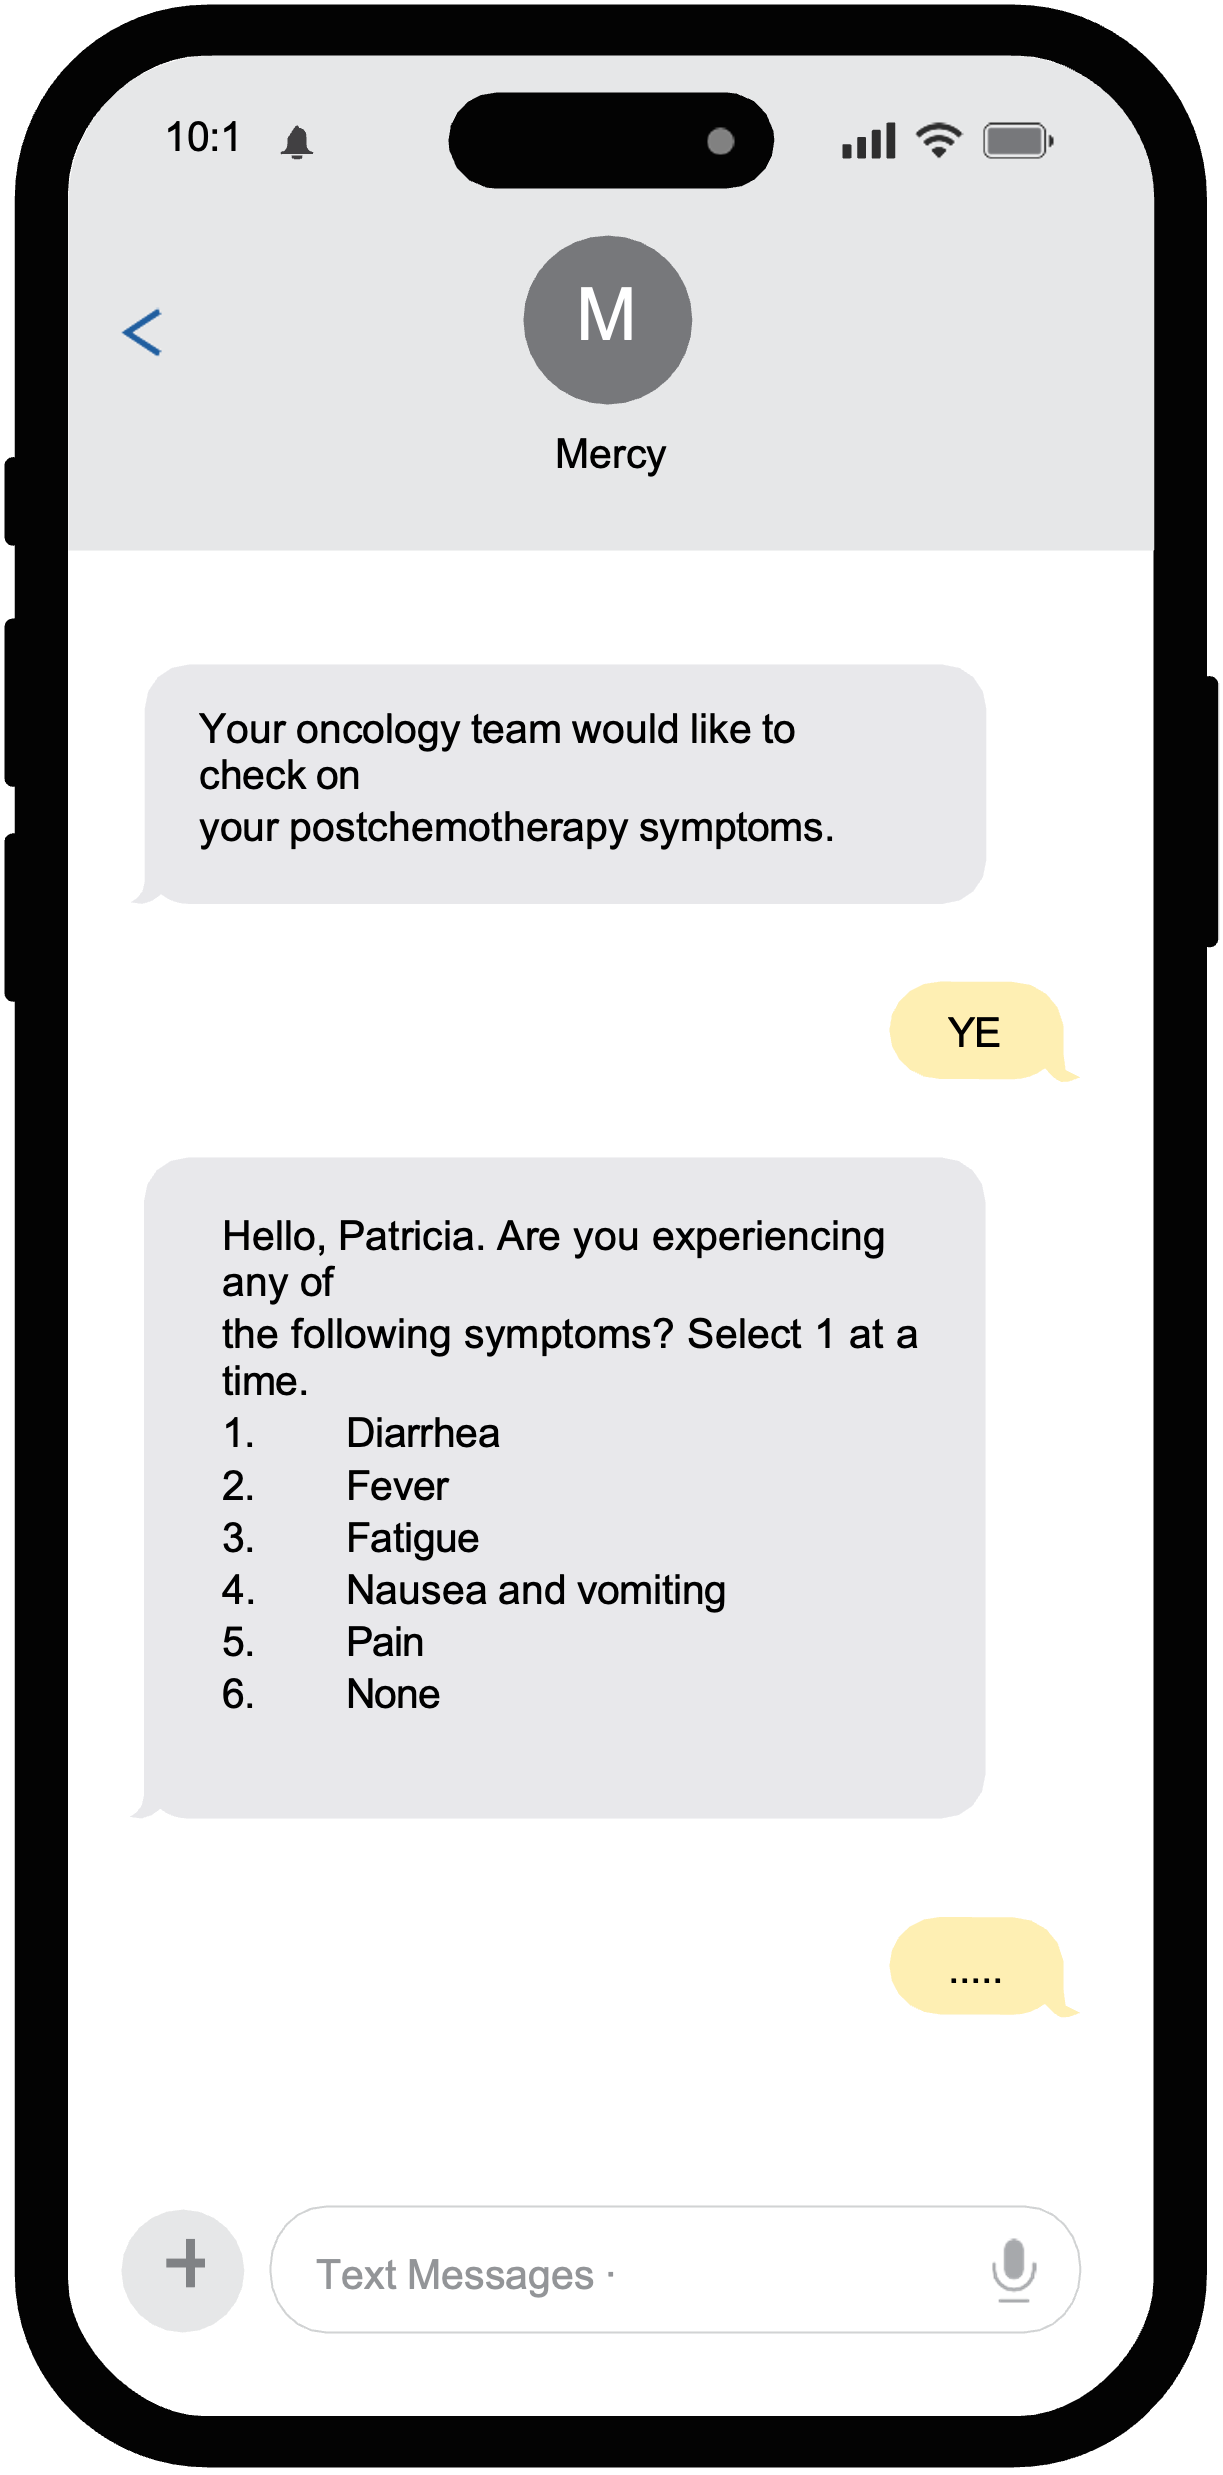
*Patients will receive Opt in text once. If they respond YES, they will receive the survey everyday for 7 days except weekends and holidays. Patients can type STOP at anytime to no longer receive the surveys.
For all patients who respond with a symptom that requires esca- lation, an automated in-basket message is sent to the triage team associated with the clinic where patients received chemotherapy. These in-basket messages have a red banner to visually alert the triage team to patients with a significant OP35-related symptom. The triage team also has visibility into patient responses to prepare them for the discussion with the patient. The triage team then calls patients to perform a further assessment and guide the next steps in appropriate proactive management. Often, these patients are directed to ambu- latory encounters for further evaluation or interventions such as hydration and transfusions, eliminating the need for an ED visit or IP admission.
Outcomes From Smart Texting
The Chen Model and associated smart texting led to the identification and ongoing monitoring of the following 7 key performance indicators:
- Number of patients prescribed chemotherapy
- Number of patients receiving smart texting
- Number of patients opting in to smart texting
- Smart texting response rates
- Rate of respondents completing the symptom survey
- Rate of in-basket messages to the oncology clinics
- Rate of chemotherapy-associated IP admissions.
In the first 10 months of Mercy’s smart texting program, 60.3% of patients who received smart texts responded to the texts (opted in). Among those patients, 13% of responses generated an escalation (visit) to the triage (outpatient) clinic for further patient assessment and intervention. Interestingly, patients associated with clinics in rural communities had a lower response rate to the smart texts than those in urban communities. It was also noted that women were more likely than men to respond to the smart text, and married patients were more likely than nonmarried ones to respond. Response rates decreased for patients over age 76 years. For the 10 months of the smart texting program, a lower rate of IP admissions was found among smart text responders (4.0%) compared with nonresponders (4.3%). At the 3-month data analysis, the ED visit rate was lower with smart text responders at 5.7% compared with nonresponders at 6.7%.
Between months 3 and 10 of the smart texting program, Mercy health system performed a major conversion of clinics from their previous ambulatory status to hospital outpatient department status. This change affected all smart texting because the conversion required a renaming of the clinics, which disrupted the entire automation process. Despite this setback, Mercy’s rate of IP admissions remains lower among smart text responders.
Next Steps and Conclusions
To support the workflow of these patients at high risk, many Mercy clinics are blocking appointment times to address same-day symptom management and/or evaluating a symptom management clinic model to serve patients with cancer after hours and during weekends. Another ongoing effort is to refine and improve the chemotherapy education process, which includes the benefits of smart texting and automated outreach to help identify risks that could be proactively managed to avoid an ED visit or IP admission.
Development of the Chen Model, the process of posting risk scores to a dashboard for review by the clinical team, and implementation of smart texting have helped Mercy streamline symptom management, reduce both IP admissions and ED visits, and improve the cancer journey for patients and families. These efforts have also improved the efficiency of Mercy’s clinical teams—at scale and across its entire health system.
Michelle Eichelmann is executive director of Oncology, Integrative Medicine, and Precision Medicine Services at Mercy Health St. Louis in Missouri. Jay Carlson, DO, is medical director for the Oncology Service line and clinical chair of Mercy Research at Mercy Health St. Louis in Missouri. Catherine Axtell is lead data scientist at Mercy Health St. Louis in Missouri.
References
1. National Cancer Institute. Financial burden of cancer care. In: Cancer Trends Progress Report. Updated March 2024. Accessed February 10, 2025. https://progressreport.cancer.gov/after/economic_burden
2. Cancer facts & figures 2023. American Cancer Society. 2023. Accessed February 10, 2025. https://www.cancer.org/research/cancer-facts-statistics/ all-cancer-facts-figures/2023-cancer-facts-figures.html
3. Rico JF, Caterino JM, Stephens JA, et al. Variables associated with admission rates among cancer patients presenting to emergency departments: a CONCERN group study. Emerg Cancer Care. 2023;2:7. doi:10.1186/ s44201-023-00022-z
4. Fleshner L, Lagree A, Shiner A, et al. Drivers of emergency department use among oncology patients in the era of novel cancer therapeutics: a systematic review. Oncologist. 2023;28(12):1020-1033. doi:10.1093/oncolo/oyad161
5. Centers for Medicare & Medicaid Services. Review of 2007 commercial claims data for cancer patients. Medicare & Medicaid Research Review. 2007.
6. CMS Measures Inventory Tool. Centers for Medicare & Medicaid Services. Accessed February 10, 2025. https://cmit.cms.gov/CMIT
7. Hospital Outpatient Quality Reporting Program: OP-35: Admissions and Emergency Department Visits for Patients Receiving Outpatient Chemotherapy. Centers for Medicare & Medicaid Services. Updated September 10, 2024. Accessed February 10, 2025. https://www.cms.gov/medicare/quality/ initiatives/hospital-quality-initiative/hospital-outpatient-quality-reporting- program


")


